
Introduction
The Seventh Day Churches of God (COGs) believe that natural disasters are fulfilling Bible prophecy of the end-times. Can this view be supported by the data on natural disasters?
The COGs also believe that the white English-speaking peoples are descended from the twelve tribes of Israel and that these nations are being punished by natural disasters because they once knew the God of the Bible and rejected him and his truth. Is it true that these nations are suffering from natural disasters worse than other nations?
The English-speakers are not believed to be all of the tribes, just the leading tribes. The COGs believe the other tribes migrated to Northwestern Europe or remained in Judea (Palestine). In this article I will refer to any nations the COGs regard as part of the twelve tribes as "Israel" and call the rest of the world "Gentiles".
The Facts Please, Just The Facts
Let's look at some data without dramatizing, sensationalizing, or using scary pictures. A little bit of science is worth more than reams of hype.
There are a few major scientifically verifiable facts about disasters to keep in mind. These might surprise anyone who has been reading Church of God (COG) literature, but below I provide data to back up these points. (The links to my sources of data are in the footnotes). These are the key facts:
While natural disasters are not really increasing, there is increased data collecting, increased reporting, increased populations, and increased dollar costs (due to monetary inflation and more buildings). These things can make it look like the frequency and severity of disasters is getting worse. When disasters strike certain areas they sometimes kill more people and cause more financial damage than they would have in the past. But that does not mean disasters overall are more deadly, more severe, or more frequent.
The actual data of the major disasters shows there is no clear trend of natural disasters themselves actually increasing around the world as we get "nearer the end". High death tolls in some areas do not prove prophecy is being fulfilled. Even if more people were dying (which does not seem to be the case), it would not prove the weather is becoming more severe or that prophecy was being fulfilled, except perhaps for the "prophecy" which says "be fruitful, and multiply" (Gen 1:28).
Severity and Frequency
The COGs have been saying that both the severity and frequency of disasters is increasing in accord with Bible prophecy. So we will look at both the severity and frequency of disasters. Proving that neither one or the other is increasing should be enough to get open minded people to do a serious re-think about COG prophecy.
Looking at some "worst-ever disasters" lists is easy to do and shows no evidence that the severity of disasters is increasing as time goes on.
In putting this information together I searched the internet for some lists of the worst disasters. I put some of the information in the footnotes to allow busy people to get to the most important data sooner.
The first footnote covers the worst few natural disasters in all the world from 1970 until the 2010 earthquake in Haiti. The second footnote covers just one recent year in detail, showing the the worst disasters in 2009. If COG prophecy is correct we should see a clear trend in both lists supporting their claims, but we don't. The reader should look at these footnotes later, but for now, let's get right to our most comprehensive data.
The Worst Disasters Ever Recorded
The most comprehensive data I found was on the Wikipedia lists of natural disasters. Looking at the dates, places, and death tolls, it is clear that the 1800's and early 1900's had plenty of suffering, and the Israelites have fared far better than many other peoples. Readers are encouraged to look at the Wikipedia lists for themselves later, but here are some highlights from those lists, summarized for the reader's convenience.
First, let's look at the frequency, i.e. are disasters getting more common with time? [Keep in mind that I researched this article and wrote it up in 2010 so the lists could have changed since, but the main trends should be the same].
Now, let's look at where the worst disasters occured.
It is interesting that although eight of the 10 worst-ever storms were in "Israel" the death toll in Venezuela far surpassed all the others combined. Further, most of those in "Israel" were in one nation, Norway, which is regarded as one of the ten tribes, but is not English-speaking. The COGs have been saying that the English-speaking tribes will be punished the most.
Of course, a lot of these disasters were in the last 100 or 200 years. Does that mean we entered the time of the end within the last 100 or 200 years?
Tracking disaster information is not an exact science because of gaps in the historical record due to poor record-keeping. We would expect record-keeping to be better in richer nations than poorer nations. We would also expect record keeping in more recent times to be better than in past centuries. As a result, better record-keeping would likely have reported an even higher percentage of disasters in "Gentile" countries and in earlier times. So it looks safe to say that we are not in a time when disasters in the world are getting worse or when God is punishing "his people" with natural disasters.
As time goes on, rising populations should tend to increase the death-toll while better preparedness should tend to reduce it. But if God is using disasters to get our attention, it seems logical to expect him to compensate for better preparedness with more and worse disasters.
The COG Disaster Reporting Perspective
It is very important to understand the approach that I am using here and how it differs from the COG approach. It is just a matter that I say one thing and the COGs say something different? Is it just a matter that I quote some statistics (perhaps selectively) and they quote some other statistics (perhaps selectively)? No. I am using a fundamentally different approach to looking at the question.
The COGs do not have a balanced perspective. To get current events in perspective we cannot just focus on a few countries in recent years. We must look at the broad picture of history (a larger time scale) and the whole globe (larger geographical region).
All the major COGs (United Church of God, Living Church of God, Philadelphia Church of God, Restored Church of God) are based in the United States and see a lot of American news so they hear a lot more reporting about USA disasters than they do about disasters outside the USA. This leads them to believe that prophecy is being fulfilled by natural disasters striking "modern Israel". They focus their reporting and personal news watching on the English-speaking nations because that is where most of the ministers and members live, where most of their readers live, and the part of the world they think God wants them to watch most closely so they can "warn" and be aware of "events that are fulfulling prophecy". Because they speak English they read and hear the news in English which is primarily about English-speaking peoples. The result of all this is that they have a skewed perspective on natural disasters, supposing that the English-speakers are being hard hit by God's punishment. They do not report on other parts of the world to the same degree.
I should add a caveat, that I have not kept up with all these churches, so I'm generalizing based on the ones I'm more familiar with and on their traditional approach. It is possible that some of them are changing their tone, but I doubt if that is happening to a great degree in the larger churches. They tend to be quite conservative, and to change their approach to prophecy significantly they would have to sharply deviate from Herbert Armstrong's teachings, which I consider unlikely.
Let's break down the COG approach point by point then compare it to the approach used in this article.
1) The COGs are convinced that they are in the end-time.
2) They are convinced God commands them to look for, and expects them to find, events that "fulfill end-time prophecy".
Points 1 and 2 have a combined effect. As they see it, the Bible "can't be wrong" and "we know we are in the end time" so when disasters occur, this must be the fulfillment of what Jesus said in the Olivet prophecy (Matt 24, Mark 13, Luke 21) or the four horsemen of Revelation (Rev 6:1-8). They think they are following trends but they are not; they are reading preconceived ideas into current events.
3) They believe prophecy says God will punish "modern Israel" (primarily the white English-speaking nations) in the end-time, so when these nations are hit with disasters, it must be God's punishment.
4) They believe that they are comissioned with the grave responsibily to "warn modern Israel" about these events.

Since they have to "warn" people, they have to write about these events and they have to tie them in with prophecy. Further, they have to "preach a strong warning message" (which has the result of scaring people) or else they would not be doing what they think God commanded them to do—"CRY ALOUD, spare not, lift up thy voice like a trumpet, and shew my people their transgression, and the house of Jacob [Israel] their sins." (Isa 58:1). The "cry aloud, spare not" attitude explains the hype, though they don't consider it hype. Once COG even calls their flagship magazine The Trumpet.
So they watch and report on the news, but the news is subject to lots of drama, a short-term focus, and regional bias. When a disaster is reported in the news the COGs write about it with grave warnings about prophecy being fulfilled.
They cite frightening statistics about the latest disasters ("the crisis of the day") with a focus on English-speaking nations, and try to persuade people of the truth of Bible prophecy as they understand it and God's punishment on the wicked. (I agree that the wicked would benefit from some punishment, but that is another matter).
My approach is entirely different. Unlike the COGs, I don't believe I have to warn anybody to escape the same punishment as the wicked. I don't have to be dramatic. I don't have to "prove" disasters are increasing or that they are striking one part of the world in particular. I don't have to focus on recent events. I don't have to "have faith" that we are living in the end-time to please God. ("But without faith it is impossible to please him," Heb 11:6). All I have to do is check whether disasters really are increasing and whether Israel is really being hit hardest.
Instead of following the news media I look at reference material. Instead of having my eyes glued to the television, getting caught up in the emotional drama, I read "dry" research articles and do a little math. And instead of having a short-term focus I look back decades or centuries to see if disasters are really getting worse. Instead of focusing on one region (English-speaking nations) I look at the whole globe. Instead of getting caught up in the hype of disaster reporting, I look for an ojbective way to measure the severity of the actual disasters.
When a disaster occurs, instead of losing our perspective—citing scary statistics and repeating emotional accounts of human misery—it is better to compare it to other disasters on the lists of "worst disasters". Rarely will it even make the list. Instead of assuming "end-time events are speeding up", it is better to check the actual frequency of disasters.
Of course, these disasters are terrible, even if just one person dies, but let's keep them in perspective.
If the COGs were right, the trends they believe are happening should be clearly visible in the data I used. The evidence would be impossible to hide. If disasters are getting worse as time goes on, a disproportionate number of the top disasters should be in the last few years, or at least the last few decades, but this is not the case. And if God were focusing his punishment on the white English-speaking nations, a disproportionate number of the top disasters should be in those nations, but that is not the case. If God is using disasters to "get our attention" as the COGs often say, we should see clear and unmistakable trends because the Bible itself says: "For if the trumpet give an uncertain sound, who shall prepare himself to the battle?" (1 Cor 14:8). How could God say something like that and then "give an uncertain sound" himself?
Since the 1930s the COG has been saying that we are in the end-time. They use natural disasters as proof. But the frequency and severity of disasters during that time have not supported those claims.
What about Global Warming?
This is not an article on so-called "Global Warming," a huge subject in itself, but we have heard so much about it that I think it bears some mention.
Despite the media hype, distortion, and outright suppression of information, the facts show that global temperatures have risen only very slightly in the last 100 years, that most of that rise was before 1950 when far less fuel was being burned, and that temperatures globally might be declining in the last few years.
Most of the information we hear about global warming is theory and hype, much of it about what some fear will happen—runaway global warming. Theory alone is not science and hype is not fact. Checking out some good web sites skeptical of global warming will give a more balanced picture. I've heard people say we have to exaggerate (i.e. lie about) global warming to get people to respond to the "crisis". So these people seem to want the media to lie to us. The media seems only too happy to oblige. I agree that preserving the environment and saving energy are critically important, but I don't believe we should lie to people about these things.
Anyway, rising temperatures by themselves prove nothing with respect to prophecy because Jesus did not prophesy rising temperatures.
And if rising temperatures were really causing disasters to get worse, we should see that reflected in the lists of worst-ever disasters, but we don't.
Finally, if COG prophecy is being fulfilled, those disasters not related to weather (e.g. earthquakes, which were specifically prophesied in Matt 24:7) should still be getting worse and hitting Israel the hardest, but this is not the case.
Summary
Facts are stubborn things, and those who do not look at them will not be corrected by them. It is not wise to believe, without checking up very carefully using independent sources, what the COGs say about "increasing natural disasters" coming on "modern Israel" or even the world as a whole. This information should be obtained from a more objective and scientific source.
We need to learn to search out information on our own rather than rely on those who bring information to us through their broadcasts or magazines. Usually, those who bring us information have an agenda, which is why they are bringing us that information in the first place, and why they present it the way that they do.
So instead of looking at one short time period covering just the last few disasters with a skewed focus on English-speaking nations in the West and talking about how bad it is, I look at the actual places and times of the top disasters all over the world. I did not selectively report disaster information about the "crisis of the day" (or decade) in the news. I looked for lists of the most important disasters everywhere and everywhen. These lists do not show that COG prophecy is being fulfilled.
What Can We Conclude?
What can we conclude from the data?
In summary, there does not seem to be any correlation between actual disasters and Bible prophecy as understood by the COGs.
How do we explain this data in view of COG prophecy and what is written in the Bible? Some possible explanations might be:
What about the possibility, raised above, that we need to look at longer lists? What if the destruction from lots of smaller disasters adds up to more than from the few worst disasters? I hope to look at longer lists when time permits, but some of the lists on Wikipedia already show the top 20 or 70. (If someone knows of reputable longer lists, please email me). Furthermore, it often seems that a few really bad disasters cause more destruction than many smaller ones. We can see this trend on some of the lists. For example, the 1972 Iran blizzard killed 4,000 people. The next 9 blizzards in the list of top 10 blizzards killed 2521 combined.
What about the argument that worse disasters will start happening soon? Nobody can prove what will happen, we can only look at what has happened. Even if we believe things will soon get worse, how do we explain that these churches, supposedly led by God, have been telling us for decades that we are already in the time that prophesied disasters are striking us? And if our sins are so bad already, why hasn't God stepped up the punishment yet? Why is he waiting? Furthermore, if God waits until the last minute to punish us, how will people have time to study his truth and repent?
I conclude that COG prophecy about natural disasters is based on using facts selectively while ignoring the major trends. They are reading preconceived ideas into world events.
Footnote 1: Worst Disasters From 1970 to 2010
This disaster list covers the worst few natural disasters, as a proportion of population (second last column), in all the world from 1970 until the 2010 earthquake in Haiti. That's four decades.
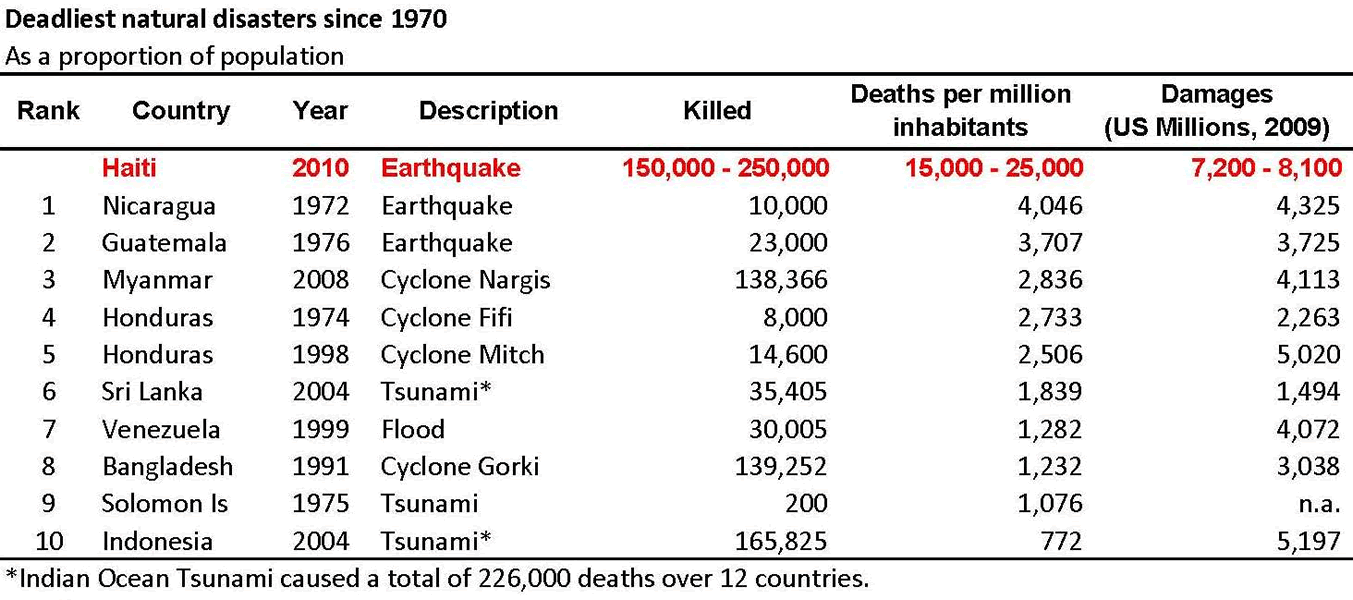
There is a sharp upward trend in the death count in the last few years. This is partly attributable to population increases. The world population doubled between 1970 and 2010.
But as far as disasters hitting "modern Israel", note that not a single one of those countries is in the list.
Now let's look at this same list again and pay attention to the frequency of the disasters on the list. Are we getting more major disasters as time goes on? To help us determine this I broke down the list by decade and counted the number of major disasters in each decade. Here is how the frequency of the top few disasters breaks down by the decade.
| Decade | Number of Top Disasters |
|---|---|
| 1970 to 1979 | 4 |
| 1980 to 1989 | 0 |
| 1990 to 1999 | 3 |
| 2000 to 2009 | 2 |
| 2010 to 2019 | 1 (so far) |
First, note that the 2004 Indian Ocean tsunami is on the first list twice because of the resulting death toll in two different countries, but I am only counting it once on this second list because it was only one disaster.
As far as frequency is concerned, we do not see more disasters in the list as time goes on. The data for the decade 2010 to 2019 is not complete because that decade has just begun. For the other four decades, fully 44% (4 of the 9) on this list occured in the first decade. So the frequency actually dropped over this 40-year time span.
A longer list (say the top 100) would be a better test because we have here only a small statistical sample. However, since we have quite a few "top 10" or "top 20" lists to look at, we can still get a pretty good indication of both the frequency and severity of disasters.
So the results from this source are mixed. The death count is up but the frequency is down and all of the disasters on the list hit "Gentiles." So by two out of three measures it does not support the COG prophecies. Mixed results are what we would expect just from "random" events that show no trend. If events are random, sometimes they will seem to follow a trend and sometimes they will not. Even random events might seem to follow a trend out of pure "luck" or if we only look at a small amount of data. The more data we look at the more we reduce the likelihood of "luck" throwing off our results.
Some people might find the above list a little bit confusing or misleading because it ranks disasters in order of "deaths per million inhabitants" (second last column) rather than by the total number of people killed (third last column), so that's one reason I use several different sources of lists.
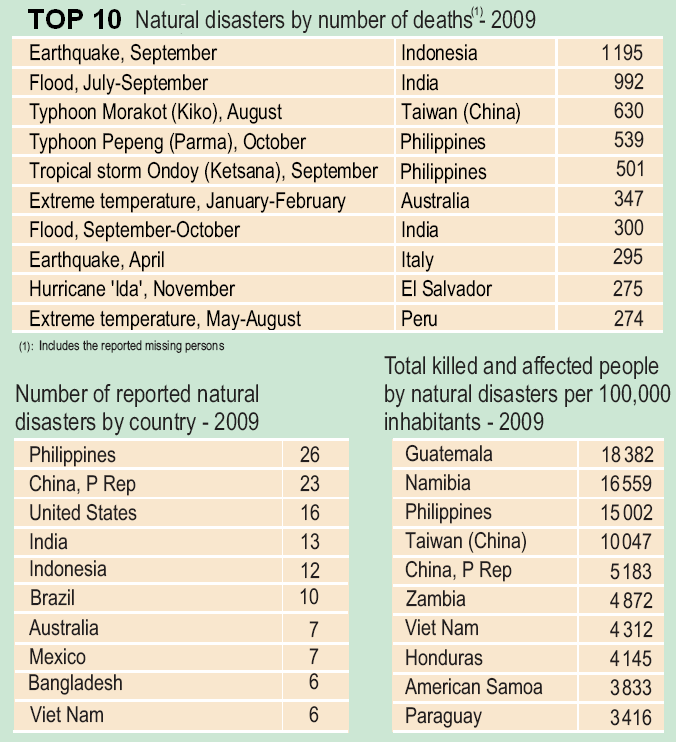
Footnote 2: The Worst Disasters In 2009
This source shows only one recent year, 2009. But it shows three top-ten natural disaster lists for that year. Each list measures something different. Note that two Israelite countries (the USA and Australia) make the list of "reported" disasters (possibly due to better record-keeping or reporting in advanced countries), but only Australia makes the top ten in terms of deaths. No Israelite country is on the top ten list of the people "affected". If God is punishing modern Israel we would expect a lot of people in those nations to be "affected" in order for the punishment to be effective.
Adding up the death toll of the top ten, 347 died in "Israel" and 5001 elsewhere. That is a ratio of about 1 to 14.
These three lists show that, at least in 2009, disasters were striking the "Gentiles" harder than they are striking "Israel."
Footnote 3: Links And A Note On The Sources
The Wikipedia list of natural disasters is probably a much better source than the COGs. Wikipedia articles are often politicized since anyone can edit them, but on technical matters they seem to be generally very useful. I expect their lists of disasters to be pretty objective. These lists are accompanied by little or no commentary so we get numbers not sensationalism. I use Wikipedia because it is a source many are familiar with and which they can get for free and find very easily. Eventually, I hope to obtain data directly from universities and government sources, but, due to a lack of time, this is all I have right now. What's nice about Wikipedia is that in one place we can find lists of the deadliest floods, famines, tidal waves, hurricanes, earthquakes, diseases, land-slides, blizzards, heat-waves and more. The information in Wikipedia is subject to change (due to updates and editing) but, until quite a few really big disasters take place there should be no significant changes in the data or the conclusions from when I looked at the lists in October 2010.
The source for the worst disasters from 1970 to sometime in 2010 is here.
The source for the worst disasters in 2009 is here.
The current version of the Wikipedia list can be seen here. If this link is ever changed (broken) just go to Wikipedia and look for the list of natural disasters.
Footnote 4: Yet More Data
In February 2012 I added the four tables below to this article. Different experts provide different estimates, so there are a few discrepancies. However, we are looking for major trends, so that should not be a problem.
Ten Deadliest Natural Disasters of All Time, Worldwide.
I got this list from Wikipedia in February 2012. In some cases, the estimated fatalities varied, so I usually took the average of the high and low estimates. Nevertheless, I kept the rank order (1 to 10) the same as that given in Wikipedia. The main point to be noted is not the exact number of dead but the fact that none of the countries that made the list are part of "modern Israel".
| Rank | Death toll | Event | Location | Year |
|---|---|---|---|---|
| 1. | 1,750,000 | 1931 China floods | China | 1931 |
| 2. | 1,450,000 | 1887 Yellow River flood | China | 1887 |
| 3. | 830,000 | 1556 Shaanxi earthquake | China | 1556 |
| 4. | 500,000 | 1970 Bhola cyclone | East Pakistan (now Bangladesh) | 1970 |
| 5. | 316,000 | 2010 Haiti earthquake | Haiti | 2010 |
| 6. | 300,000 | 1839 India Cyclone | India | 1839 |
| 7. | 270,105 | 2004 Indian Ocean Tsunami | Indonesia, India, Sri Lanka | 2004 |
| 8. | 275,000 | 526 Antioch earthquake | Byzantine Empire (now Turkey) | 0526 |
| 9. | 242,419 | 1976 Tangshan earthquake | China | 1976 |
| 10. | 234,117 | 1920 Haiyuan earthquake | China | 1920 |
Ten Deadliest Natural Disasters of the Past Century, Worldwide.
I got this list from Wikipedia in February 2012. Note that none of the countries in this list are part of "modern Israel".
| Rank | Maximum death toll | Event | Location | Year |
|---|---|---|---|---|
| 1. | 257,000--436,000 | 1931 China floods | China | 1931 |
| 2. | 242,419--779,000 | 1976 Tangshan earthquake | China | 1976 |
| 3. | 300,000--500,000 | 1970 Bhola cyclone | East Pakistan (now Bangladesh) | 1970 |
| 4. | 316,000 | 2010 Haiti earthquake | Haiti | 2010 |
| 5. | 230,000--310,000 | 2004 Indian Ocean Tsunami | Indonesia | 2004 |
| 6. | 234,000 | 1920 Haiyuan earthquake | China | 1920 |
| 7. | 142,000 | 1923 Great Kanto earthquake | Japan | 1923 |
| 8. | 138,000+ | 2008 Cyclone Nargis | Myanmar | 2008 |
| 9. | 138,000 | 1991 Bangladesh cyclone | Bangladesh | 1991 |
| 10. | 120,000 | 1948 Ashgabat earthquake | Turkmenistan | 1948 |
USA Earthquake Fatalities by Decade
I compiled this list from information I found on Wikipedia in February 2012. Note that earthquake fatalities in the USA are not increasing, which contradicts the view that God is punishing "modern Israel."
| Decade | Earthquake Fatalities |
|---|---|
| 1900 to 1909 | 3000 |
| 1910 to 1919 | 0 |
| 1920 to 1929 | 0 |
| 1930 to 1939 | 120 |
| 1940 to 1949 | 182 |
| 1950 to 1959 | 47 |
| 1960 to 1969 | 147 |
| 1970 to 1979 | 65 |
| 1980 to 1989 | 73 |
| 1990 to 1999 | 36 |
| 2000 to 2009 | 3 |
USA Earthquake Events
I copied this list from Wikipedia in February 2012. This is the list I used to compile the smaller table that shows the number of earthquake fatalities in the USA in each decade.
| Year | State | Magnitude | Fatalities | Event |
|---|---|---|---|---|
| 1700 | 8.7 - 9.2 | 1700 Cascadia earthquake | ||
| 1755 | Massachusetts | 5.9 | 1755 Cape Ann earthquake | |
| 1811 | Missouri | 7.2 - 8.1 | 1811-1812 New Madrid earthquakes | |
| 1857 | California | 7.9 | 2 | 1857 Fort Tejon earthquake |
| 1867 | Kansas | 5.1 | 1867 Manhattan earthquake | |
| 1868 | Hawaii | 7.9 | 77 | 1868 Hawaii earthquake |
| 1868 | California | 6.8 - 7.0 | 30 | 1868 Hayward earthquake |
| 1872 | Washington | 6.5 - 7.0 | 1872 North Cascades earthquake | |
| 1872 | California | 7.6 - 8.0+ | 27 | 1872 Lone Pine earthquake |
| 1886 | South Carolina | 7.3 | 60-110 | 1886 Charleston earthquake |
| 1906 | California | 7.9 | 3000+ | 1906 San Francisco earthquake |
| 1909 | Indiana | 5.1 | 1909 Wabash River earthquake | |
| 1915 | Nevada | 7.1 | 1915 Pleasant Valley earthquake | |
| 1931 | Texas | 5.8 | 0 | 1931 Valentine earthquake |
| 1933 | California | 6.4 | 120 | 1933 Long Beach earthquake |
| 1940 | California | 6.9 | 9 | 1940 El Centro earthquake |
| 1940 | New Hampshire | 5.5 | 1940 New Hampshire earthquake | |
| 1946 | Alaska | 7.8 | 165 | 1946 Aleutian Islands earthquake |
| 1947 | Wisconsin | Unknown | 0 | 1947 Wisconsin earthquake |
| 1948 | California | 6.0 - 6.5 | 0 | 1948 Desert Hot Springs earthquake |
| 1949 | Washington | 7.1 | 8 | 1949 Olympia earthquake |
| 1952 | California | 7.5 | 14 | 1952 Kern County earthquake |
| 1957 | Alaska | 8.6 | 0 | 1957 Andreanof Islands earthquake |
| 1958 | Alaska | 8.3 | 5 | 1958 Lituya Bay earthquakes |
| 1959 | Montana, Wyoming | 7.3 - 7.5 | 28+ | 1959 Yellowstone earthquake |
| 1964 | Alaska | 9.2 | 143 | 1964 Alaska earthquake |
| 1965 | Alaska | 8.7 | 0 | 1965 Rat Islands earthquake |
| 1965 | Washington | 6.5 | 3 | 1965 Olympia earthquake |
| 1968 | Illinois | 5.4 | 0 | 1968 Illinois earthquake |
| 1969 | California | 5.6 - 5.7 | 1 | 1969 Santa Rosa earthquakes |
| 1971 | California | 6.6 | 65 | 1971 San Fernando earthquake |
| 1975 | Minnesota | 4.6 | 0 | 1975 Morris earthquake |
| 1983 | California | 6.5 | 0 | 1983 Coalinga earthquake |
| 1983 | Idaho | 7.3 | 2 | 1983 Borah Peak earthquake |
| 1984 | California | 6.2 | 0 | 1984 Morgan Hill earthquake |
| 1987 | California | 5.9 | 8 | 1987 Whittier Narrows earthquake |
| 1989 | California | 6.9 | 63 | 1989 Loma Prieta earthquake |
| 1992 | California | 6.5 - 7.2 | 0 | 1992 Cape Mendocino earthquakes |
| 1992 | California | 7.3 | 3 | 1992 Landers earthquake |
| 1992 | California | 6.5 | 0 | 1992 Big Bear earthquake |
| 1993 | Oregon | 5.6 | 0 | 1993 Scotts Mills earthquake |
| 1994 | California | 6.7 | 33 | 1994 Northridge earthquake |
| 1995 | Texas | 5.7 | 0 | 1995 Marathon earthquake |
| 1996 | Washington | 5.6 | 0 | 1996 Duvall earthquake |
| 1998 | Pennsylvania | 5.2 | 0 | 1998 Pymatuning earthquake |
| 1999 | California | 7.1 | 0 | 1999 Hector Mine earthquake |
| 2001 | Washington | 6.8 | 1 | 2001 Nisqually earthquake |
| 2002 | Alaska | 7.9 | 0 | 2002 Denali earthquake |
| 2003 | Alabama | 4.6 | 0 | 2003 Alabama earthquake |
| 2003 | Virginia | 4.5 | 0 | 2003 Virginia earthquake |
| 2003 | California | 6.5 | 2 | 2003 San Simeon earthquake |
| 2006 | Florida | 5.8 | 0 | 2006 Gulf of Mexico earthquake |
| 2006 | Hawaii | 6.7 | 0 | 2006 Hawaii earthquake |
| 2007 | California | 5.6 | 0 | 2007 Alum Rock earthquake |
| 2007 | Alaska | 7.2 | 0 | 2007 Andreanof Islands earthquake |
| 2008 | Illinois | 5.4 | 0 | 2008 Illinois earthquake |
| 2008 | California | 5.5 | 0 | 2008 Chino Hills earthquake |
| 2010 | California | 6.5 | 0 | 2010 Eureka earthquake |
| 2010 | Illinois | 3.8 | 0 | 2010 Illinois earthquake |
| 2010 | California | 5.4 | 0 | 2010 Borrego Springs earthquake |
| 2010 | Indiana | 3.8 | 0 | 2010 Indiana earthquake |
| 2011 | Colorado | 5.3 | 0 | 2011 Colorado earthquake |
| 2011 | Virginia | 5.8 | 0 | 2011 Virginia earthquake |
| 2011 | Alaska | 6.8 | 0 | 2011 Alaska earthquake |
| 2011 | Oklahoma | 5.6 | 0 | 2011 Oklahoma earthquake |